Adding Syncthing to Telegraf+InfluxDB+Grafana(TIG) stack to monitor remote machines
In the previous blog post, I set up Telegraf instances to push host metrics to an InfluxDB instance that was set up within my home network. But there’s a problem.
One of the machines that I also want to keep an eye on is a Linode VPS that I run my projects on. But to do that, the Telegraf instance running on the VPS should be able to reach the InfluxDB instance inside my network. Meaning I would need to expose my network to the outside world. And even though there are somewhat secure ways to do that, the most secure mechanism is not to expose your network at all.
In that blog post, I had alluded to this:
Note that this is known as a “push” model. This kind of model assumes that the monitored machines push their state to a central node where it all gets collected. In a future post, I will show a simple modification that I’ve adopted to also include machines that work outside my local network so needed a “pull” model. In a nutshell, I wanted to also monitor my Linode instance using the same dashboard but didn’t want to open up my local network to the wild nasty internet. Anyhow, that’s for later.
Telegraf has an input plugin that can ingest metrics from a file. And it also has an output plugin that can store metrics in a file. hmmm… so all I need to do is the following:
- Instruct the Telegraf instance on my VPS to output the metrics to a file.
- Somehow get the file-stored metrics from the server onto a machine on my local network.
- Run another Telegraf instance on the local machine to push those metrics to the InfluxDB instance.
Enter Syncthing⌗
Syncthing has been my go-to syncing application for a couple of years now. It does one thing and does it well. I already have Syncthing running on my server and syncing to multiple clients as part of my efforts to create a DIY Dropbox of sorts. So I made use of that. Step 2 above is basically adding an additional path that Syncthing will monitor.
The Details⌗
- Launch a Telegraf instance on the remote machine to output the metrics to a file. The configuration for the output plugin would look like this:
# ....only the interesting part is shown
[[outputs.file]]
  # where to output the metrics. stdout is just for debugging purposes.
  files = ["stdout", "<SOME_PATH>/metrics.out"]

  ## The file will be rotated after the time interval specified.  When set
  ## to 0 no time based rotation is performed.
  #  rotation_interval = "2m"

  ## The logfile will be rotated when it becomes larger than the specified
  ## size.  When set to 0 no size based rotation is performed.
  rotation_max_size = "1MB"

  ## Maximum number of rotated archives to keep, any older logs are deleted.
  ## If set to -1, no archives are removed.
  rotation_max_archives = 5

  ## Data format to output.
  data_format = "influx"
- Make sure that the output path for the metric files is one that Syncthing monitors on your remote machine.
- Run a local Syncthing instance to get the metric files to some machine within your local network.
- Launch a Telegraf instance on the local machine to ingest the metric files and write them to the database. The following configuration will do that:
# ....only relevant part is shown
[[outputs.influxdb]]
  urls = ["http://<YOUR_IP>:8086"]
  database = "telegraf_metrics_experimental"

[[inputs.file]]
  files = ["<SOME_PATH_TO_SYNCED_METRICS/*.out"]
  data_format = "influx"
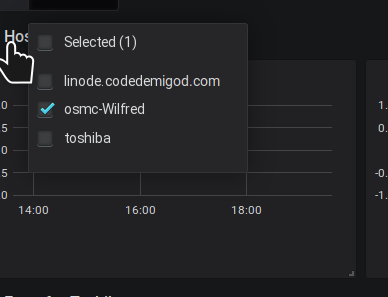
If you’ve been following along with the previous blogpost, you’ll find the remote server automatically added to the Server dropdown like so.
Notes⌗
- Play around with the rotation configuration options of the file output plugin to suit your needs. I set it to write out a maximum of 5 archives of 1 MB each to fit the speed/activity of my network connection.
- The stdout option for the file output plugin is just for debugging purposes. Once you’re sure that it is working as expected, remove that bit.
- Technically, setting up Syncthing like this is exposing your network in a way I guess. But this doesn’t allow the whole world write access to a port. So even though InfluxDB does support authentication and https traffic, I prefer not to go down this route even though I have in the past. Nothing personal, InfluxDB seems pretty good. Just that in my experience you better secure your network and not count on your database properly implementing authentication.
- Check out the documentation for the possible values for
data_format. This would allow you to use this same approach with a different collector or mix them up if you like living on the edge.