Monitoring My Servers with Telegraf, InfluxDB and Grafana
I was on the lookout for a simple monitoring solution to keep an eye on a few servers that I am managing. There’s no shortage of monitoring solutions to choose from these days. However, I got lost in a sea of complexity. Most of them were meant for the enterprise. Meaning they were slow, complex and expensive. Not surprising, I guess, considering that’s where the money is. The solutions also seemed like they were meant for monitoring 100s(1000s?) of machines and that was overkill for my situation. As a start, I wanted something that would allow me to monitor the 3 machines that I have on my home network but I also wanted a solution that can be scaled up to 10 machines at a later time.
I tried out a few until I stumbled over the TIG stack. That stack is basically made up of Telegraf(the T) for metric extraction, InfluxDB(the I) for storage of timeseries values and Grafana(the G) for dashboarding.
There’s plenty of tutorials on the internet how to set up a TIG stack for server monitoring so there’s no need to repeat it in depth here. However, I would like to show you just how beautifully simple it really is.
The monitoring solution basically consists of the following steps:
- Set up an InfluxDB instance that is reachable from any machine we want to monitor
- Run an instance of Telegraf on the machine that we want to monitor asking it to send the metrics to the InfluxDB instance from step 1
- Set up a Grafana dashboard that reads from the InfluxDB in step 1.
Setting up Influxdb⌗
This step is probably the simplest. Just follow the excellent documentation and you’ll be up and running in no time. There are many configuration options that you can change for your instance and you probably should before taking this solution to a production environment. But my experience has taught me that an iterative approach works best when your requirements aren’t set in stone(and they rarely are) so I started out with the defaults which I then tweaked as my needs changed. Besides some increased memory consumption that I am not thrilled about, it works great.
Setting up Telegraf⌗
Telegraf is also very simple to install by following the documentation as well. It can be configured to make use of specific plugins that control the metrics you are interested in for each host. You don’t necessarily need the same configuration for all the hosts but having different ones can make creating a unified dashboard a bit tricky.
Here’s a sample configuration file that I ask the Telegraf instances to use.
# Global tags can be specified here in key="value" format.
[global_tags]
  # dc = "us-east-1" # will tag all metrics with dc=us-east-1
  # rack = "1a"
  ## Environment variables can be used as tags, and throughout the config file
  # user = "$USER"


# Configuration for telegraf agent
[agent]
  interval = "10s"
  round_interval = true
  metric_batch_size = 1000
  metric_buffer_limit = 10000
  collection_jitter = "0s"
  flush_interval = "10s"
  flush_jitter = "0s"
  precision = ""
  debug = false
  quiet = false
  hostname = ""
  omit_hostname = false


### OUTPUT

# Configuration for influxdb server to send metrics to
[[outputs.influxdb]]
  urls = ["http://<YOUR_IP>:8086"]
  database = "telegraf_metrics"

  retention_policy = ""
  write_consistency = "any"

  timeout = "5s"


# Read metrics about cpu usage
[[inputs.cpu]]
  ## Whether to report per-cpu stats or not
  percpu = true
  ## Whether to report total system cpu stats or not
  totalcpu = true
  ## Comment this line if you want the raw CPU time metrics
  fielddrop = ["time_*"]


# Read metrics about disk usage by mount point
[[inputs.disk]]
  mount_points = ["/", "/mnt/externaldisk"]
  ignore_fs = ["tmpfs", "devtmpfs"]


[[inputs.mem]]
  # no configuration
# Get the number of processes and group them by status
[[inputs.processes]]
  # no configuration
# Read metrics about swap memory usage
[[inputs.swap]]
  # no configuration
# Read metrics about system load & uptime
[[inputs.system]]
  # no configuration
[[inputs.net]]
  # collect data only about specific interfaces
  # interfaces = ["eth0"]
[[inputs.netstat]]
  # no configuration
[[inputs.interrupts]]
  # no configuration
[[inputs.linux_sysctl_fs]]
  # no configuration
[[inputs.temp]]
  # no configuration
This configuration file is hopefully self evident. It extracts metrics for the CPU, the disk usage, memory, swap and so on. It pushes those metrics to the InfluxDB instance mentioned in the output plugin. You can also associate your metrics with tags in the “global_tags” section but the metrics will be accompanied with a host tag specifying where they came from anyway so no need to add it there if that’s all you need.
Note that this is known as a “push” model. This kind of model assumes that the monitored machines push their state to a central node where it all gets collected. In a future post, I will show a simple modification that I’ve adopted to also include machines that work outside my local network so needed a “pull” model. In a nutshell, I wanted to also monitor my Linode instance using the same dashboard but didn’t want to open up my local network to the wild nasty internet. Anyhow, that’s for later.
Bring on the dashboards⌗
Grafana is what we will use to visualize all of these metrics we’re collecting. It provides the user interface for this solution. I say user interface but it provides more than that. In addition to pretty charts, it provides interesting functionality when we combine those charts with the alerting mechanism to provide us with a more proactive monitoring solution.
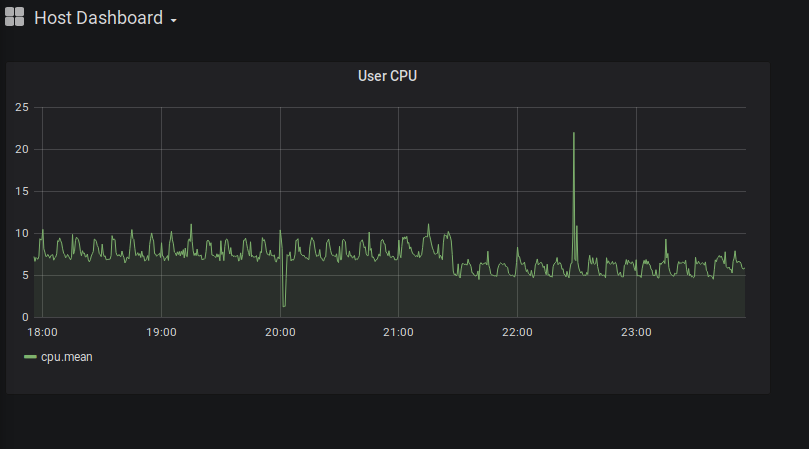
Let’s create a sample host monitoring dashboard. Start by creating a panel for visualizing the user CPU.
Well, this is great but if we have multiple hosts feeding metrics into the same database then which host is this showing? Well, I can specify the host in the panel query itself but that means I will have to create a panel for every server. It also means if I add an additional server then I’ll have to manually create even more CPU panels.
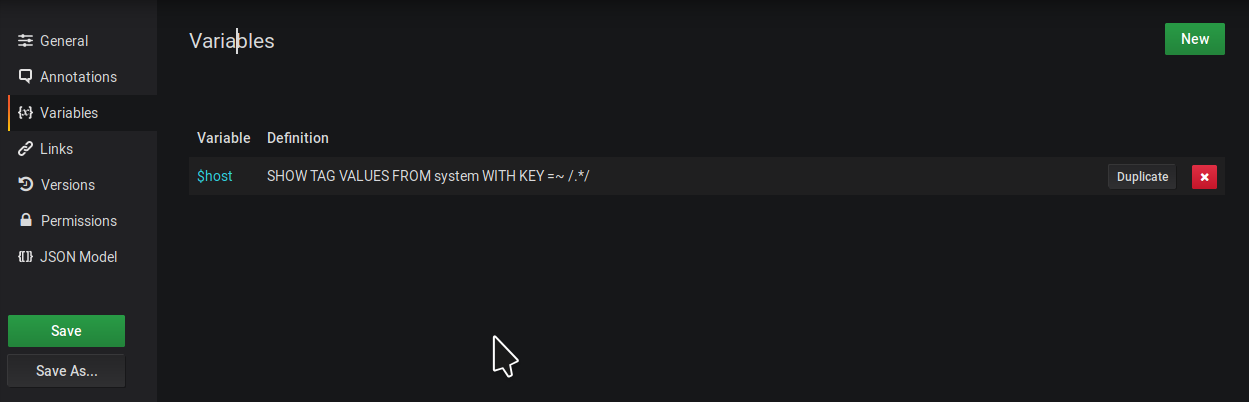
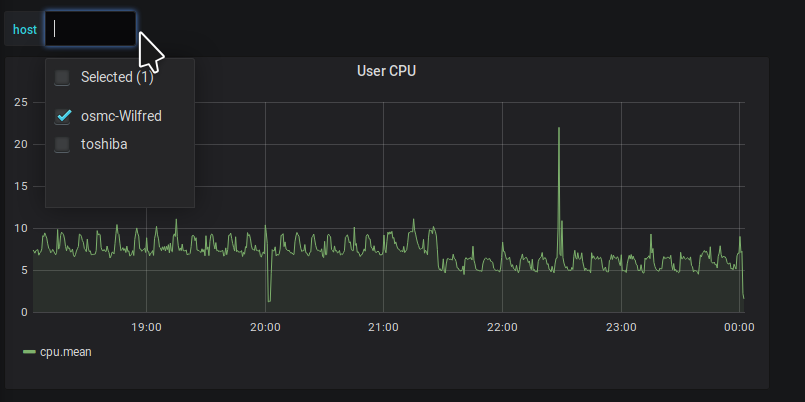
Luckily this is a common problem so Grafana defines something called “dashboard variables” to take care of this. This is basically a value that can change according to some rule(such as a user selection). So we need to create a variable to hold possible values of hosts I have available to monitor.
Go to the dashboard settings and define a variable and call it something like host or server. Define the query as “SHOW TAG VALUES FROM system WITH KEY =~ /.*/”. Note that this query will be different depending on the version of InfluxDB you’re running. There are a few open bugs about it but there doesn’t seem to be a single reason why certain queries for tag values return an empty set. On a gut feeling, I saw that the “WITH KEY” clause supports regular expressions and so I gave it a shot.
After which you’d see a dropdown on the main dashboard the contains the values of host names that exist in your database.
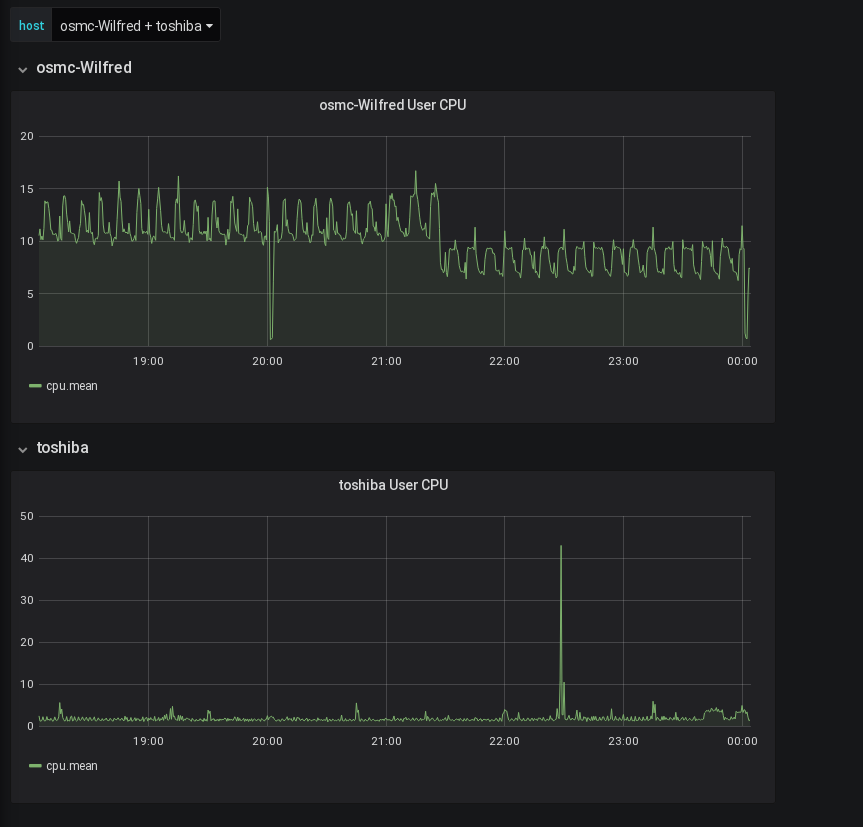
Next, convert the CPU panel to a row. Basically it will be a row with only a single panel if you’ve been following along.
Then set the row to repeat based on the host variable.
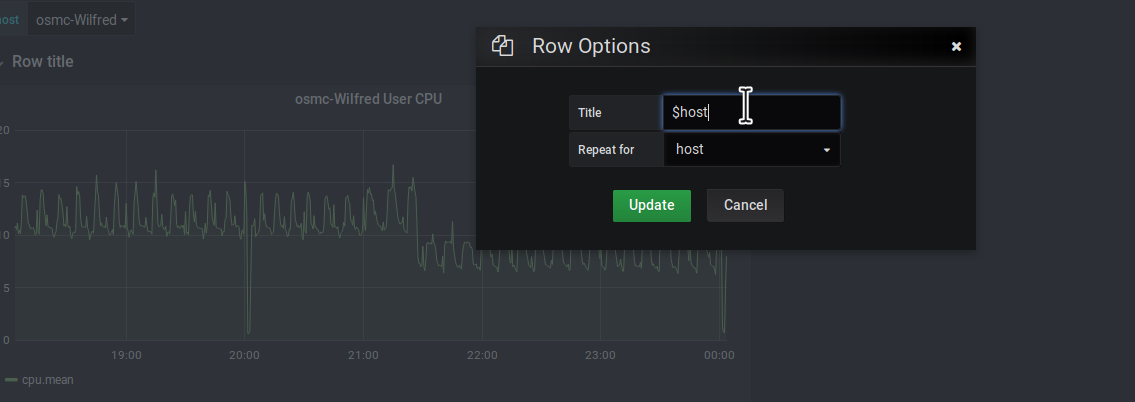
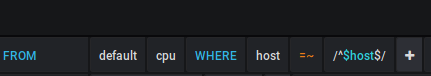
Then modify the panel query to filter by host with the value being /^$host$/. Astute readers would’ve noticed that this is how you access data variables in template systems so should be somewhat familiar. And if not, the Grafana autocompletes are great time savers.
And voila. Whenever we select an additional server from the host dropdown, a new row gets created with the panel repeated and fetching information for that specific host. Notice that I also added the host name in the row and panel titles just to make it clearer what metric I’m looking at.